Ask your question
Pose complex business queries in plain, natural language.
An AI-native platform that turns executive dialogue into visual intelligence — transforming how leaders understand, explore, and act on data with unprecedented clarity and speed.
ActBI breaks down the wall between conversation and insight. Every interaction — a question, a curiosity, a hypothesis — flows naturally into exploration and decision-making, without the friction of dashboards built for someone else.
Pose complex business queries in plain, natural language.
Our AI interprets and uncovers hidden connections instantly.
Answers come with transparent reasoning ready for executive discussion.
Traditional BI tools demand technical queries and endless setup. With ActBI, you simply ask — "How were sales this year so far?" — and your AI analyst responds in visuals, context, and narrative explanation. No middle layers. No waiting.
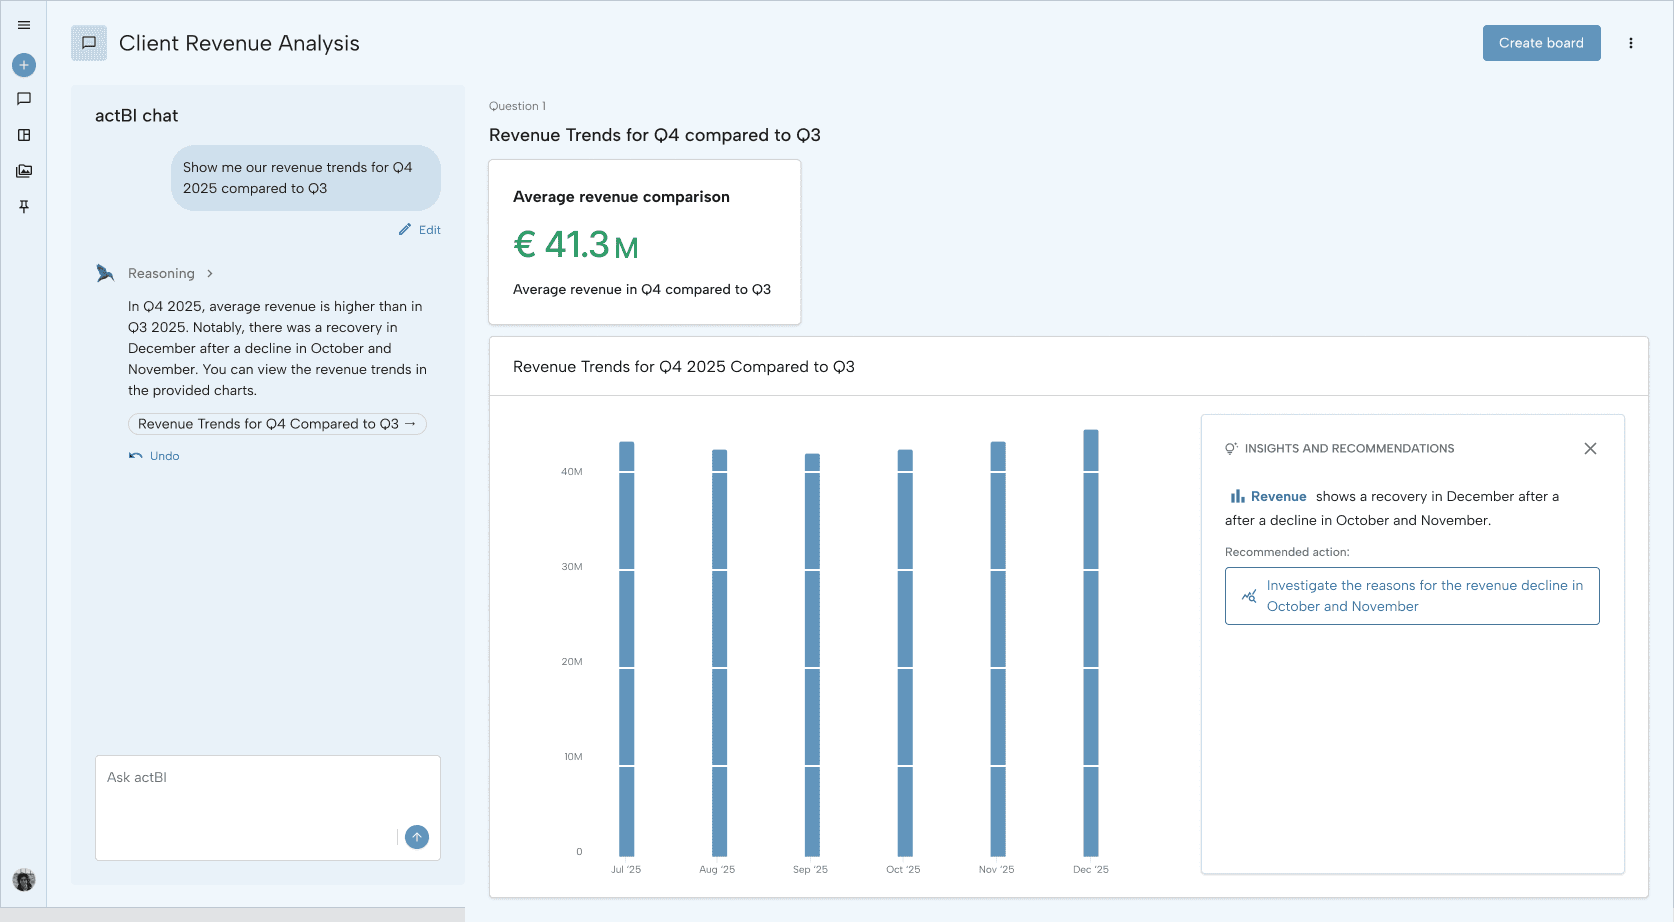
A question asked in plain language returns a metric and a chart, with the reasoning shown alongside.
Exploration with ActBI is a true collaboration. As you analyze your data, the AI becomes a sparring partner — offering fresh angles, suggesting related patterns, and prompting you to test new hypotheses. It helps you explore ideas you might not have considered, turning analysis into a creative dialogue.
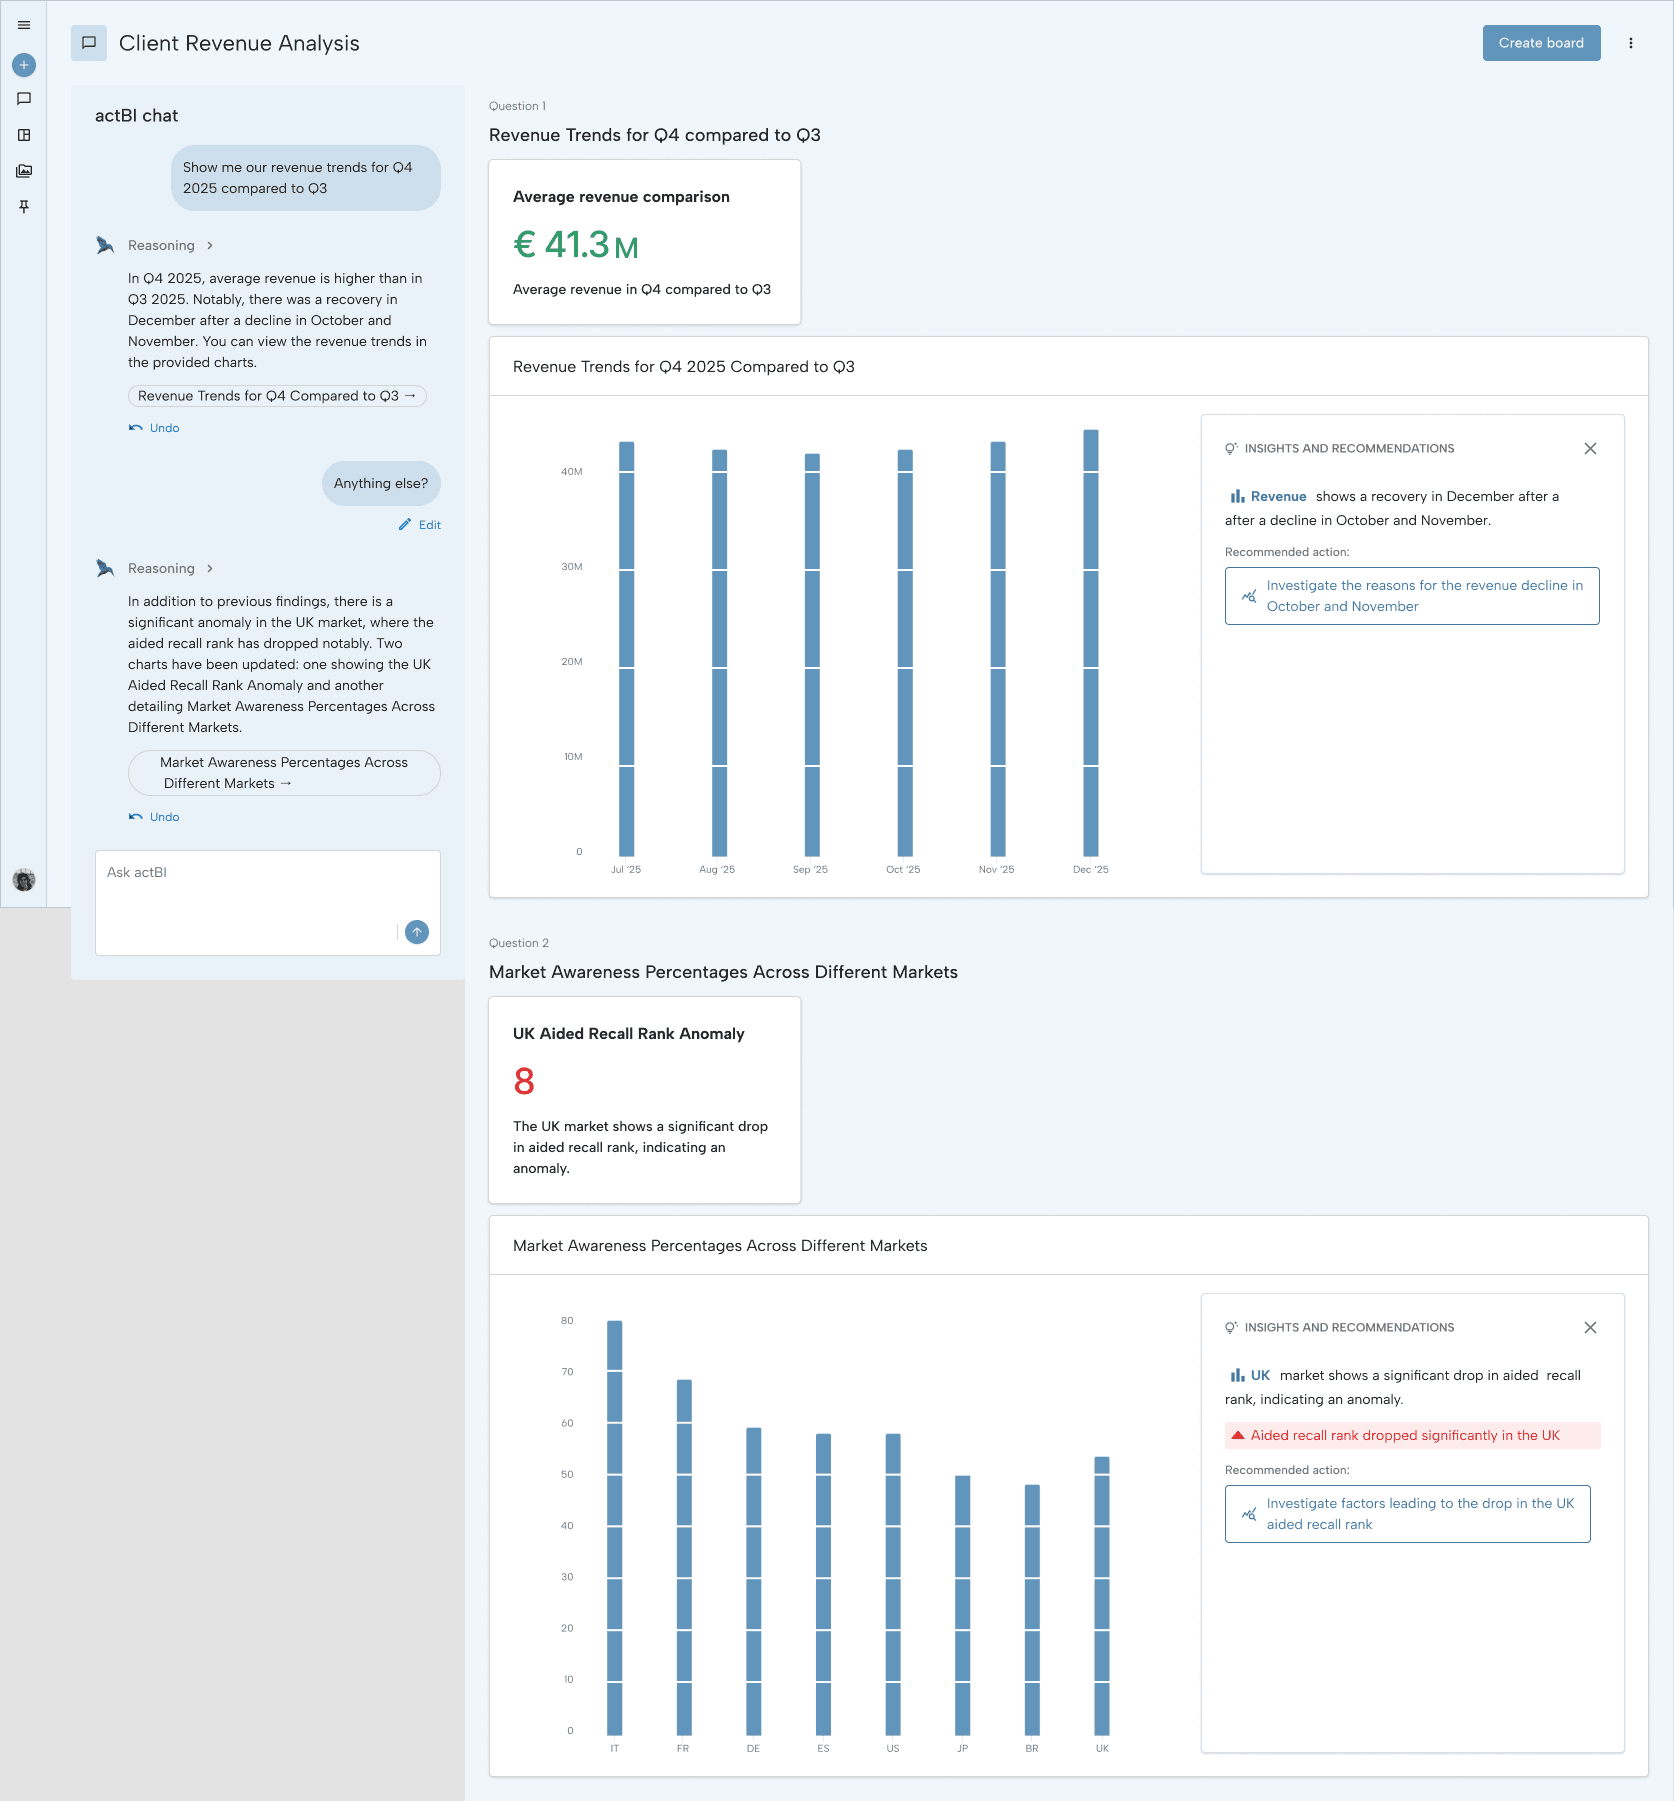
Follow-ups build on what came before — here a second pass surfaces an anomaly in the UK market.
When your visuals come to life, ActBI shifts into analyst mode. It scans the data for anomalies, highlights unexpected movements, and draws your attention to emerging trends. Ask questions, request explanations, or let the AI guide you through what’s changing and why it matters.
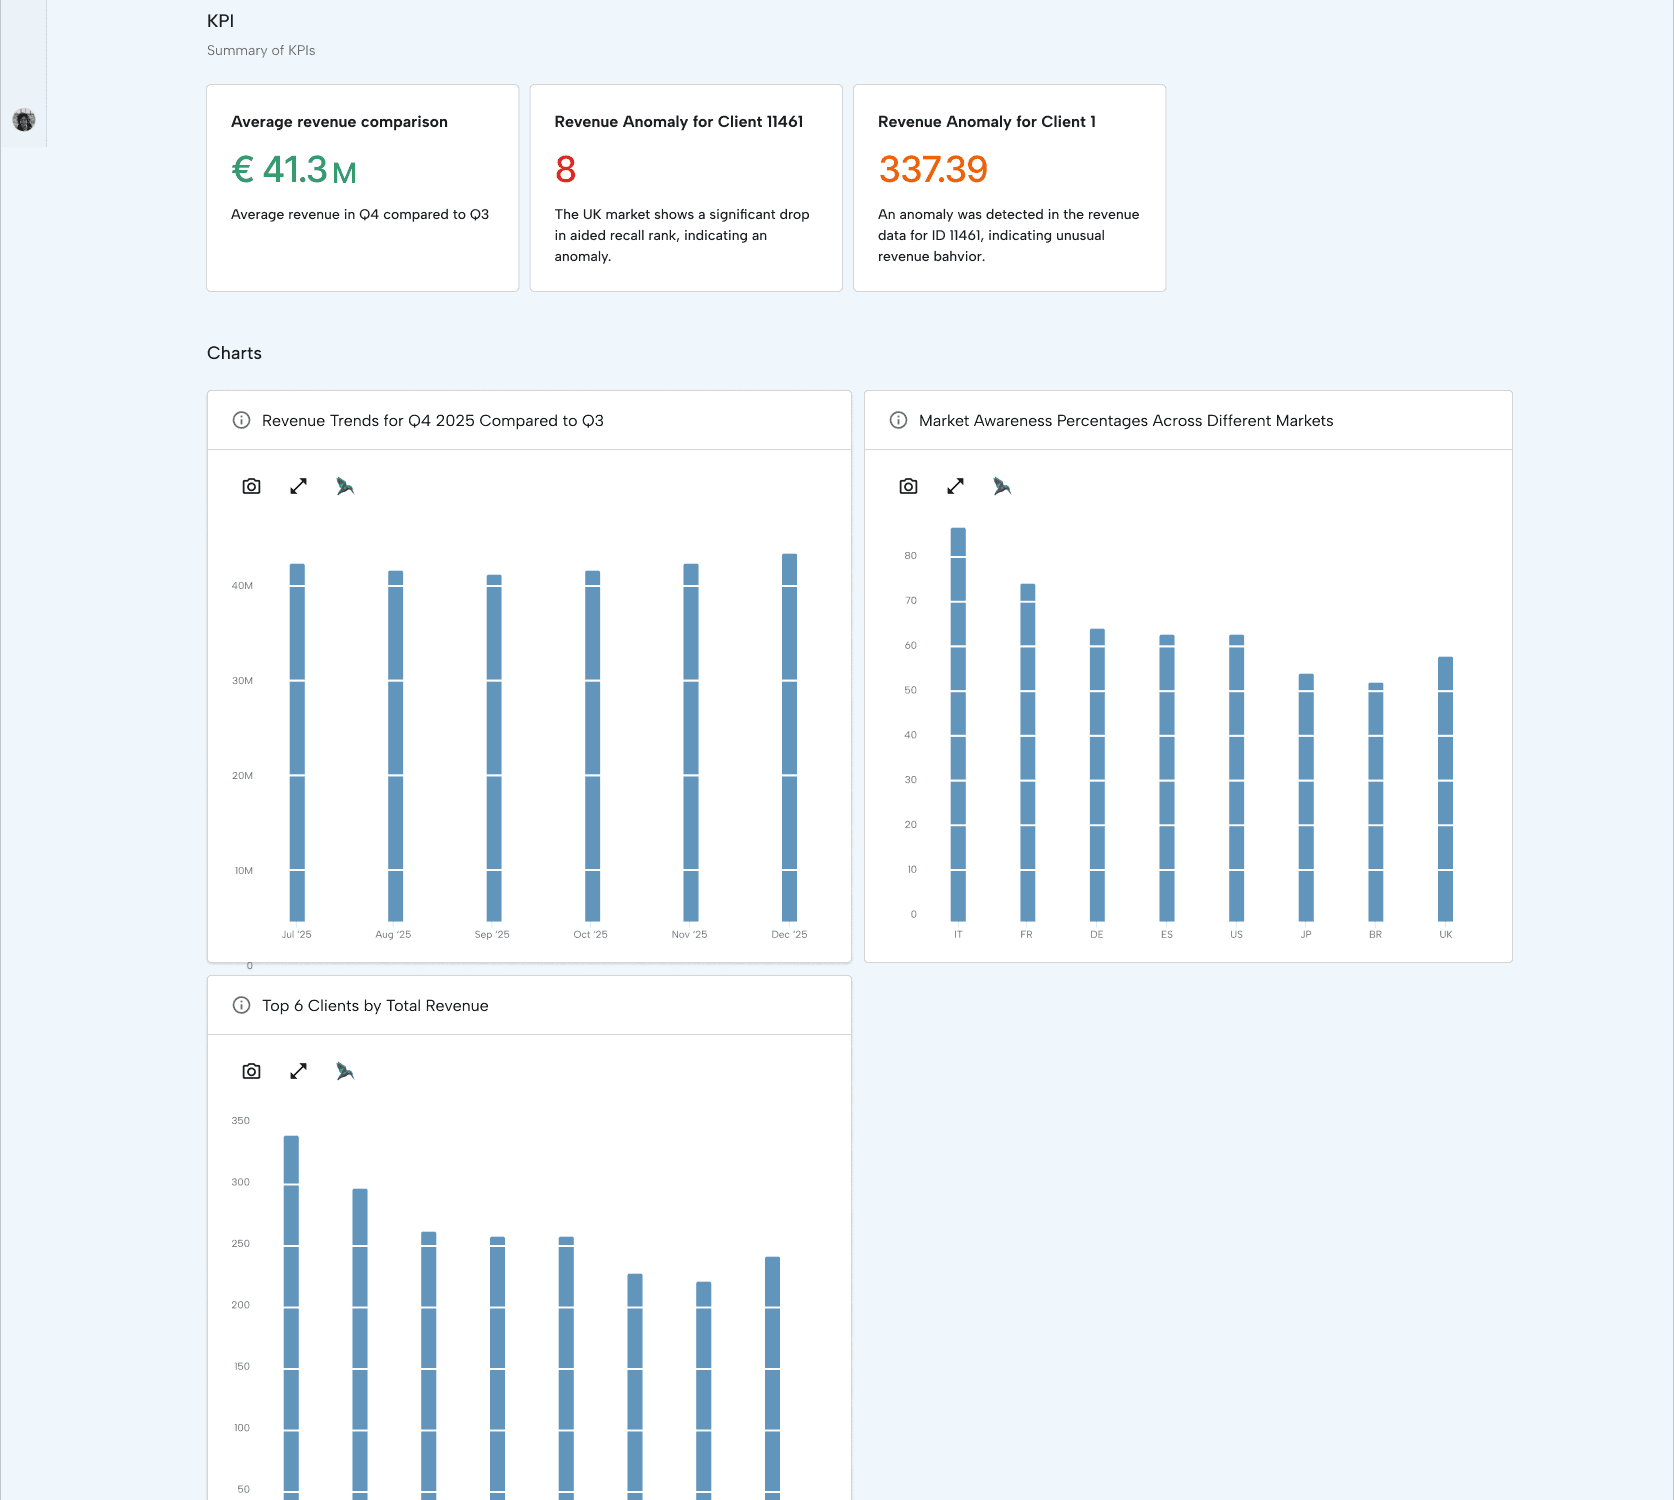
The board flags what moved — anomalies called out on the KPIs, with the charts behind them.
When an analysis is worth keeping, publish it. Every board carries its provenance: which conversation produced it, when the analysis ran, and on which data. And every time you hit refresh, we also refresh the analysis and insights.
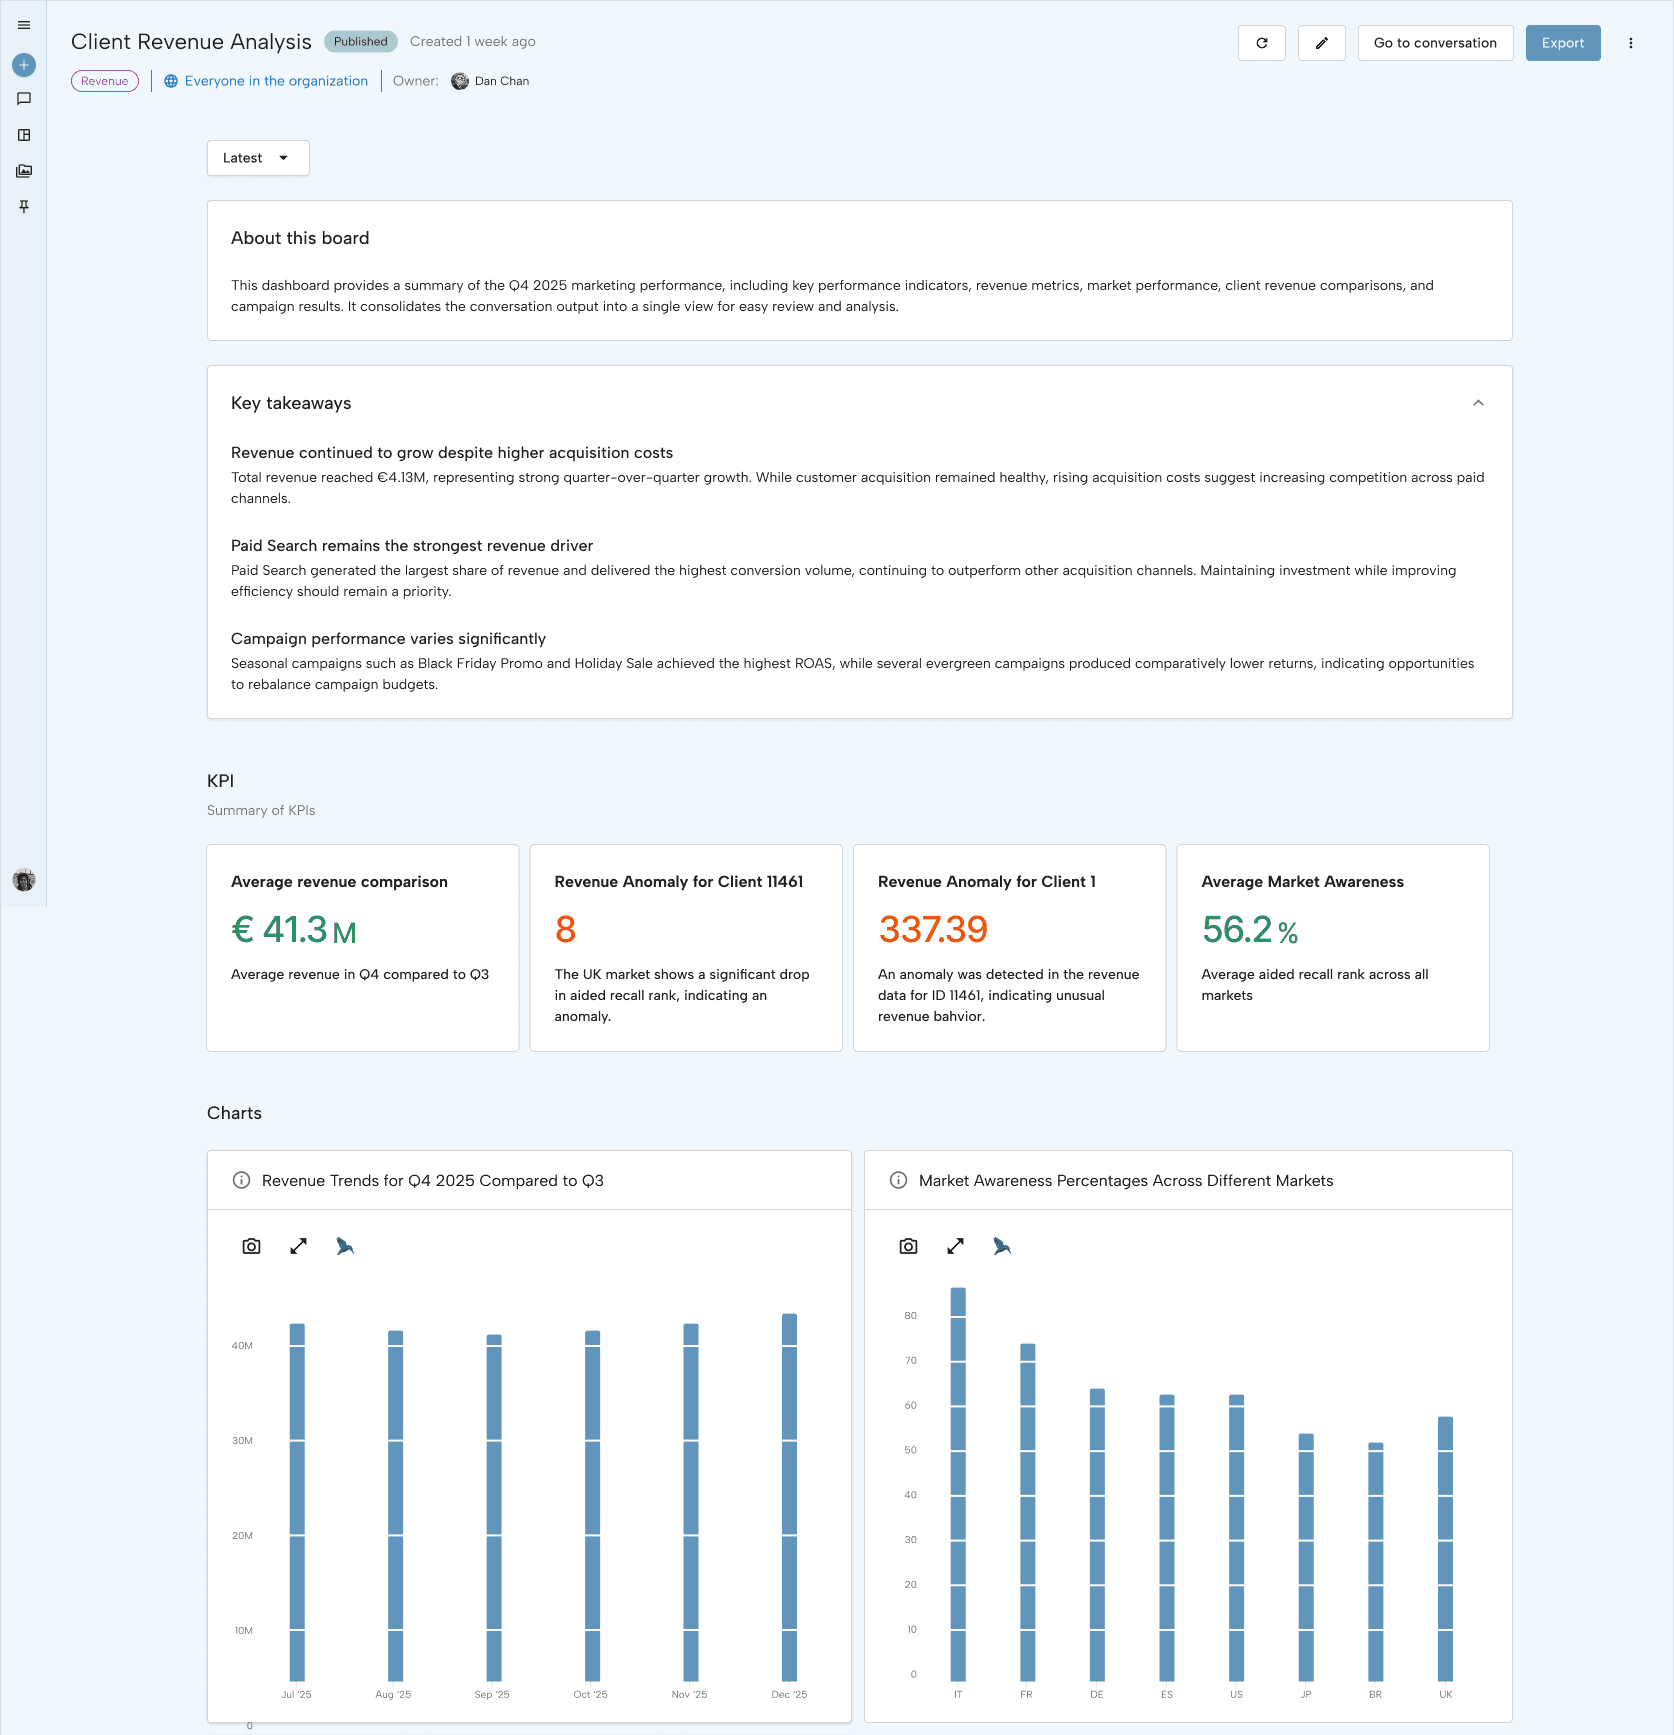
One conversation, published: takeaways, flagged KPIs and the charts behind them, shared with the organization.
Everything you publish lands in Reports — filtered by format, tagged by theme, searchable, and split between what you made and what was shared with you. New work surfaces on top, so a colleague’s Monday analysis reaches you before the Tuesday meeting.
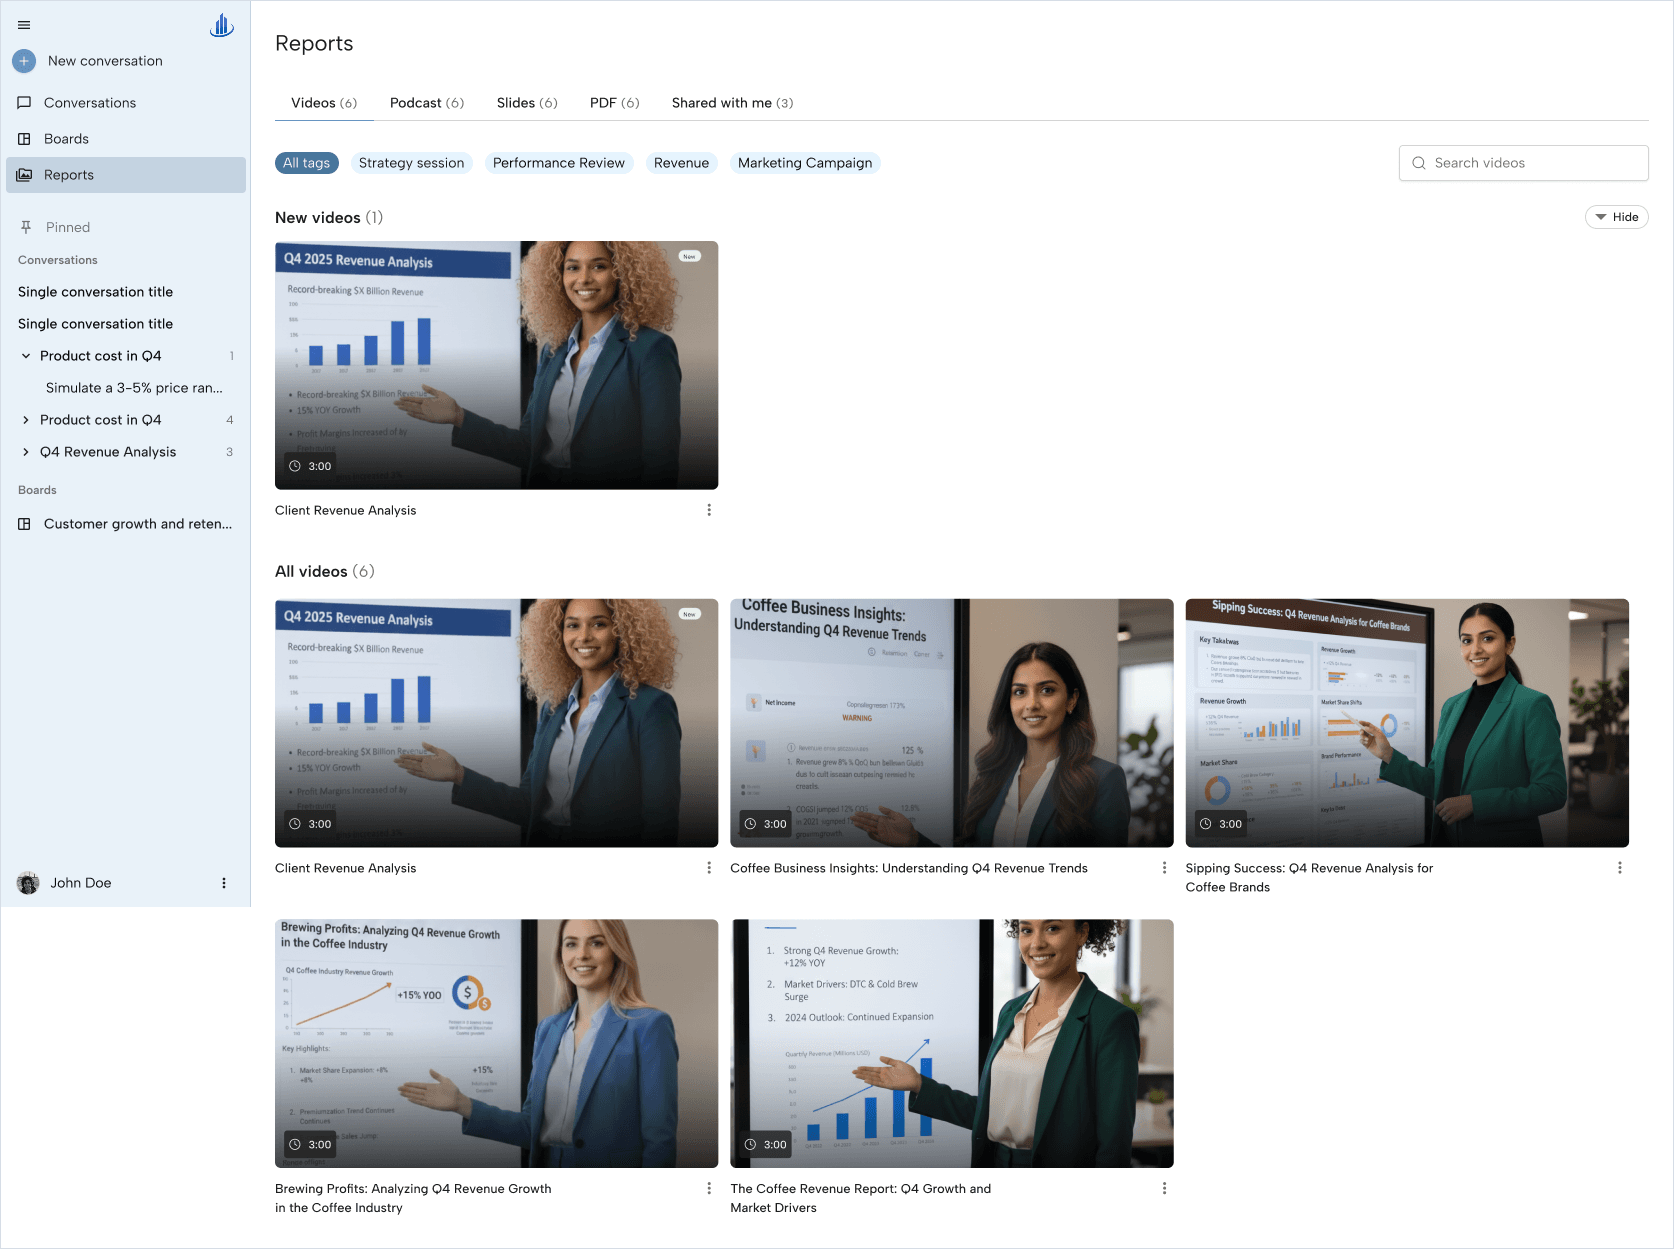
Every deliverable in one place, filterable by format and tag, with the newest work on top.
The same analysis reaches a board member, a regional manager and a commuting executive differently. ActBI generates all four from a single conversation — no deck-building evening, no re-cut for a second audience, and no version drift between them.
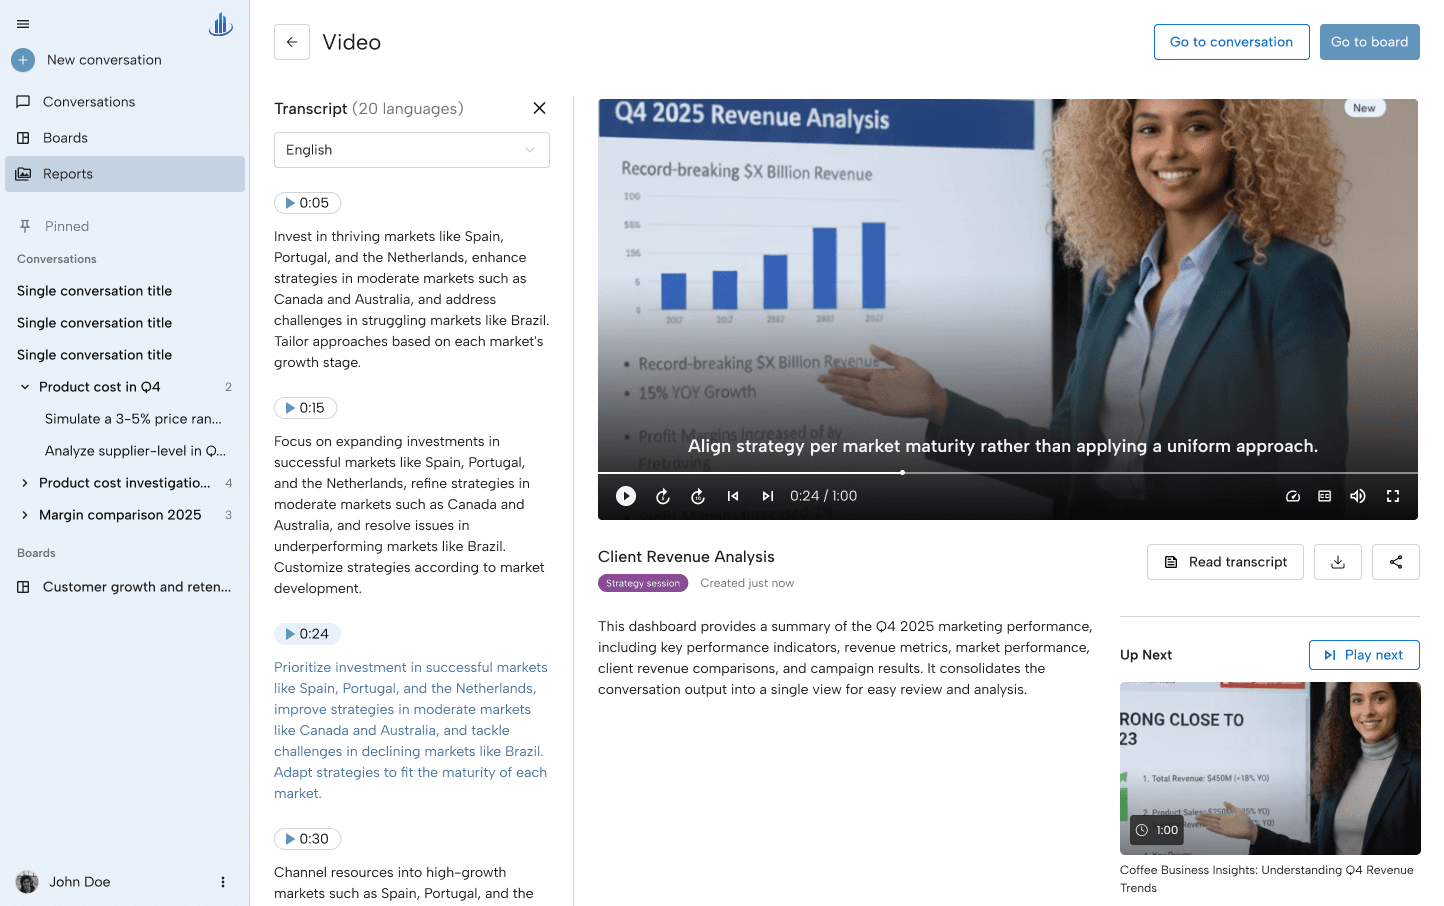
ActBI turns the analysis into a narrated walkthrough with an on-screen presenter and captions, and a time-coded transcript beside it. Change the transcript language and the same briefing reaches a regional team without a translation cycle.
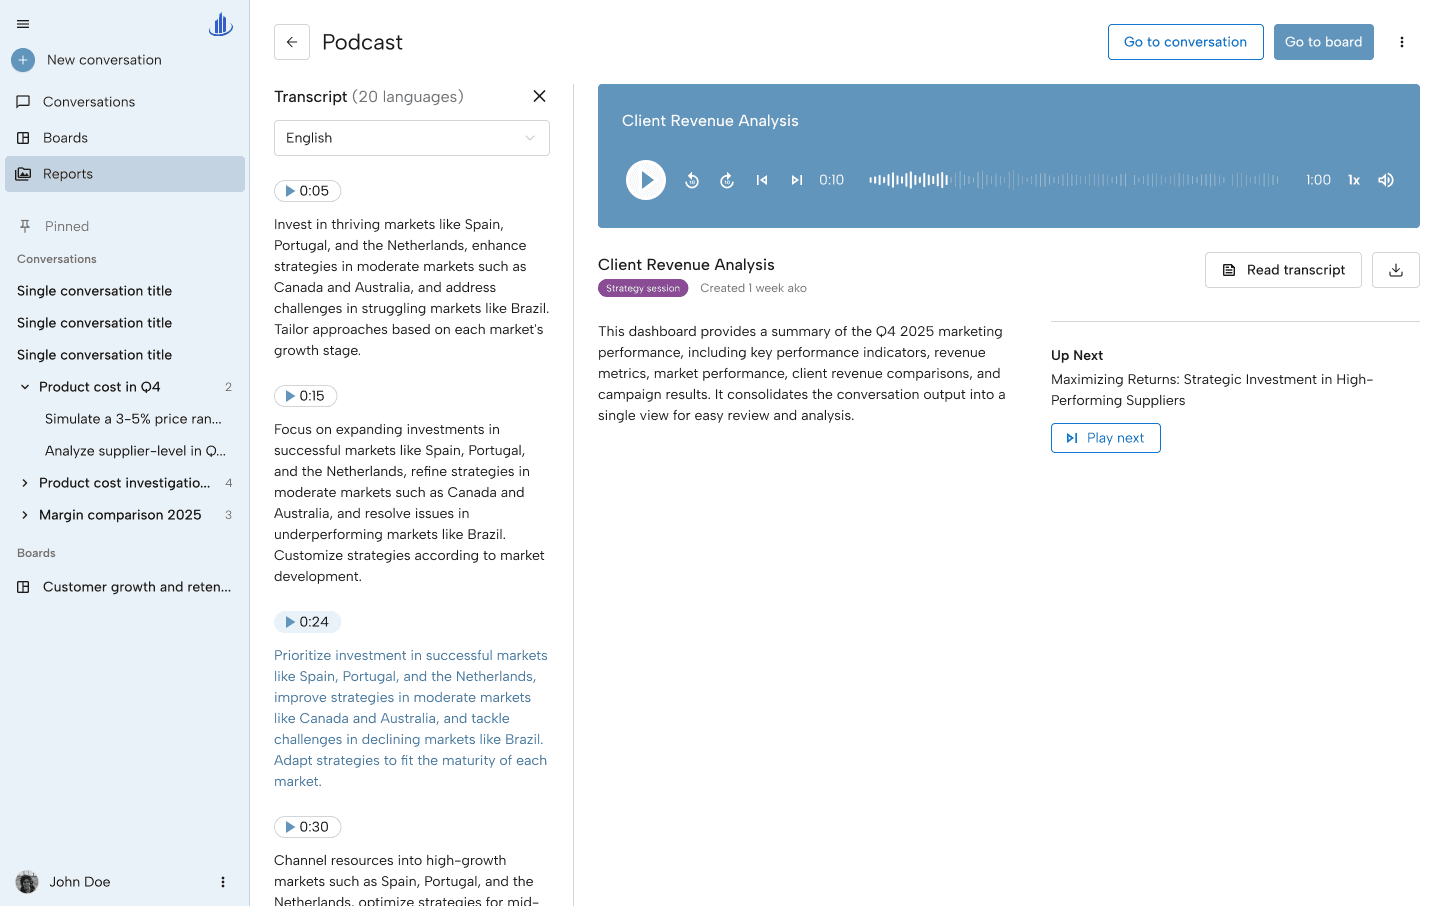
The same analysis as audio, with the transcript beside it and the next report already queued. Leaders who never open a dashboard still walk into the meeting current.
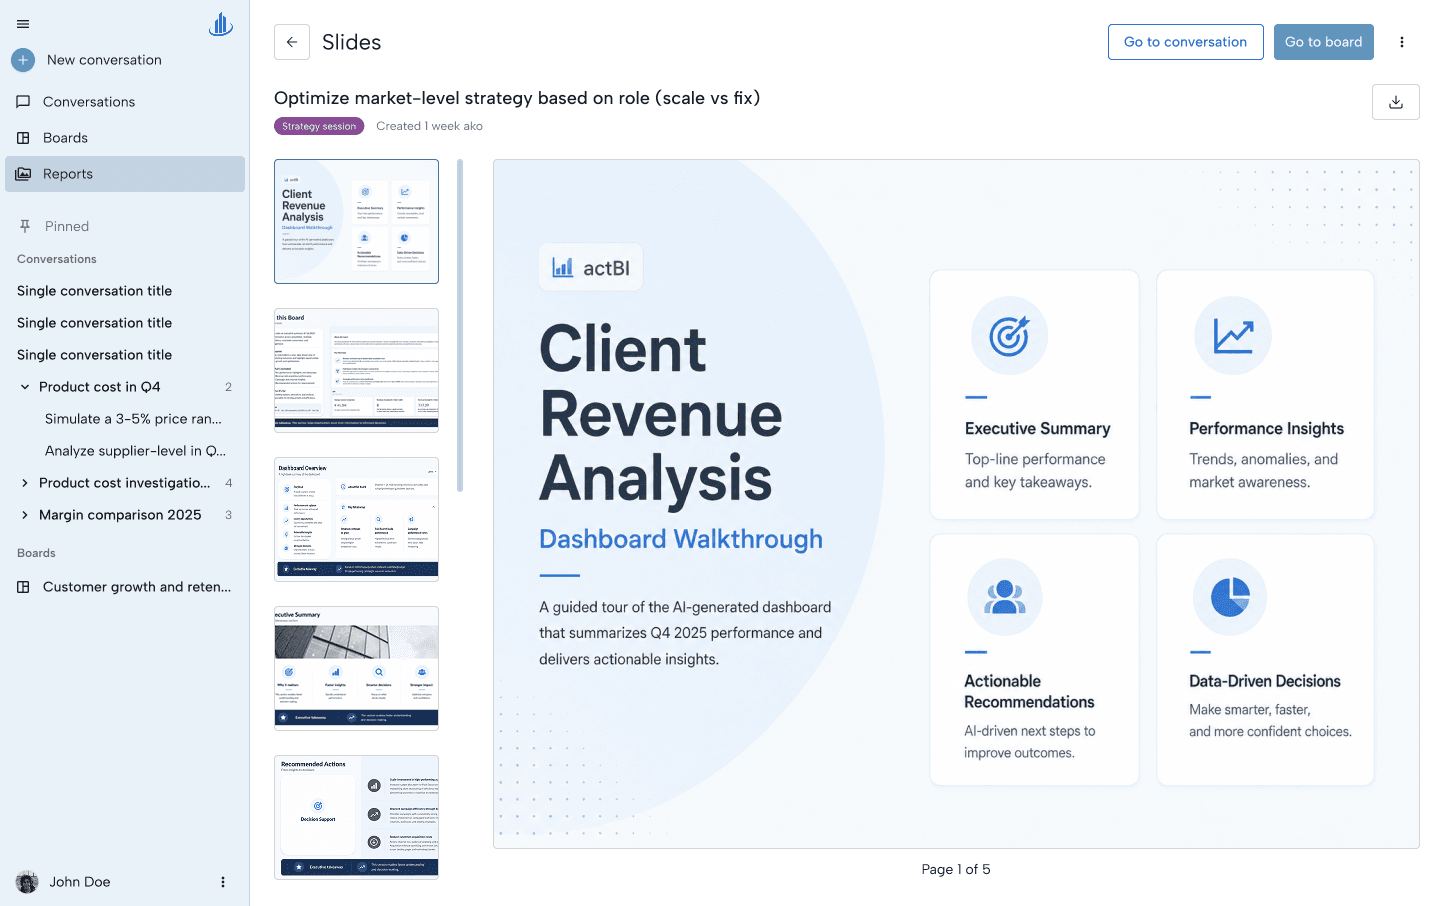
Five pages — title, executive summary, dashboard overview, performance insights, recommended actions — laid out and branded. The evening you would have spent assembling it is simply not spent.
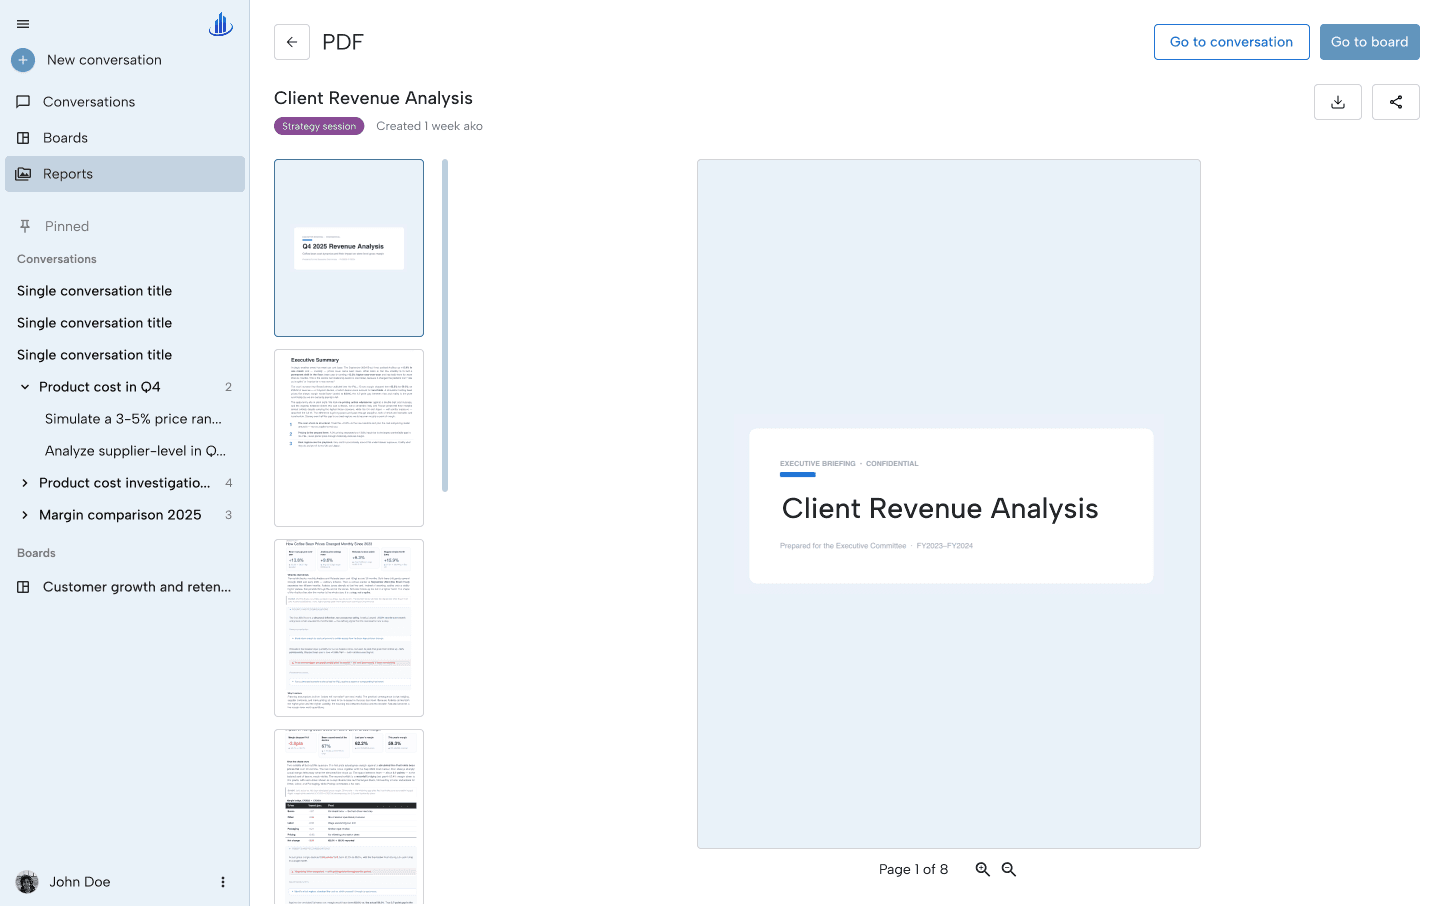
An executive briefing with the full reasoning behind the headline: the numbers, the method, the caveats. This is the artifact that outlives the meeting and still stands up when someone reopens it weeks later.
Join the visionary brands exploring AI-driven decision intelligence that speaks your language. Experience dashboards that think with you.